Enchanted WebsitesEnchanted WebsitesEnchanted Websites
 
 
HomeWhy UsHot InfoPortfolioServicesHostingSpecialtiesAbout UsContact Us
 
  Useful StatsMarketizing Your Site IMarketizing IIWhy Have a Site?


Useful Statistics

WEBSITE MARKETING STATISTICS

Impacts such website marketing issues as:
how to set realistic expectations about costs; where and how to focus promotional effort, budget, etc.


percentage of major US companies
who advertise online
1999
66%
2001
79%


Source: US Association of National Advertisers, Oct. 2001


average number of websites maintained
by major US companies
2000
6.1 websites
2001
9.7 websites


Source: US Association of National Advertisers, Oct. 2001

average development cost for the website
of a major US company
1999
$536,000 (US)
2001
$665,000 (US)


Source: US Association of National Advertisers, Oct. 2001

average maintenance cost for the website
of a major US company
1999
$590,000 (US)
2001
$691,000 (US)


Source: US Association of National Advertisers, Oct. 2001

MARKETING CHANNELS: COMPARISONS
Top 5 marketing channels used
to find a website
1 search engines
57%
2 email
38%
3 links from other websites
35%
4 word of mouth
28%
5 magazine ads
25%

Note: These statistics reflect the fact that people use more than one marketing channel.
more

Search engine listings are better than banner ads (by 3 to 1) at creating effective brands.

Source: Internet News, Feb. 2001

More online purchases originated from search engine listings (55%) than from banners (9%).
Source:
Internet News, Feb. 2001

Established preferences with longterm Internet use: most Internet users now go directly to websites (relying on bookmarks) rather than relying on search engines and links from other sites.
Percentage of Internet users who go directly to the websites they want to read:
2001: 46%
2002: 52%
Source: WebSideStory’s StatMarket, Feb. 2002
Conclusion: Get your company online and do effective branding ASAP, before everybody ceases to use search engines and links from other sites, because they already know where they want to go for what they want. Create custom icons to make your bookmark stand out from the rest.

SEARCH ENGINES

daily number of US Internet users who use search engines: 33 million
(= 29% of all US Internet users)
Source: Pew Internet and American Life, Jul. 2002

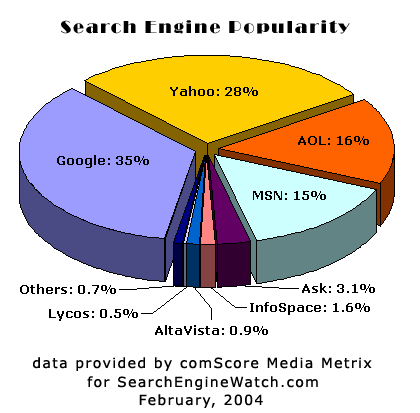
most used search engines:

Search Engine Popularity


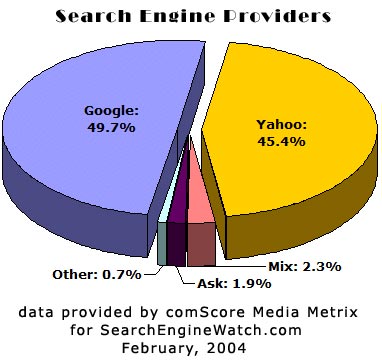
search engine providers:

Search Engine Providers


search engines with highest user satisfaction (on a scale of 100):

  1. Google: 80
  2. Ask Jeeves: 62
  3. Alta Vista: 61
  4. average across all major search engines: 68

The overall ACSI score for search engines is 68, but the differences between the largest competitors are vast. Google registers a score of 80 -- more than 30% better than Alta Vista (61) and Ask Jeeves (62). Such a difference among competitors is extremely rare and is usually limited to evolving industries. Typically, customers will flock to the best companies, with industry consolidation a probable result. The recent agreement between AOL and Google to join forces and offer AOL users the Google search engine may be a step in this direction. But it may help AOL more than Google. Not surprisingly, Google has much higher customer loyalty than its competitors. Google users tend to spend more time searching the site than do users of competitive sites: 24.1 minutes for Google users, compared with 18 minutes for AltaVista users and 16.2 minutes for AskJeeves users. Furthermore, Google led all search engines in total search hours per month per user: 11.7 hours for Google users, compared with 4.8 hours for AskJeeves users and 1.9 hours for AltaVista users. (Commentary by Professor Claes Fornell)

Source: ACSI (The American Customer Satisfaction Index), Aug 2002

search engine promotion statistics

percentage of active websites using metatags: 42%
most commonly used metatag: Refresh
("keywords" and "description" metatags are used in search engine promotion; so significantly less than 42% of all active websites are involved in search engine promotion)
Source: NetFactual, Feb 2002

EMAIL

worldwide email traffic
Source: International Data Corporation, Oct., 2000

  • 2000: 10 billion messages per day
  • 2005 (projected): 35 billion messages per day

percentage of US Internet users who check their mail on a typical day: 52%
Source: Pew Internet and American Life, Jul. 2002

percentage of US company online sales due to email-based promotions: 15%
Source: Direct Marketing Association, April 2002

percentage of US companies that believe email marketing is their most effective customer retention tool: 63%
Source: Direct Marketing Association, April 2002

More US businesses are now using email marketing campaigns than traditional direct mailings.
Source: GartnerG2, Mar. 2002

percentage of marketers who plan to increase use of email newsletters: 65%
Source: Intermarket Group, Aug. 2002

percentage of junk mail ("spam") in US businesses' daily email load: up to 30%
Source: Message Labs, Jul. 2002

percentage of people who immediately delete messages from unrecognized senders: 52%
Source: Quris, May, 2002

Sending individual email messages gets better response than multiple recipients
.
Source: New Scientist, Jul. 2002


percentage of email marketers using HTML email:
54.2%
Source: Opt-In News, Jan. 2002
(HTML email is mail that contains graphics, etc. It is contrasted with "text email".)

WORD OF MOUTH
Relationship between "word of mouth" advertising and customer satisfaction
Source: Taylor Nelson Sofres, May, 2002
  • 98% of satisfied users also say that they would recommend a site to someone they knew, compared to just one percent of dissatisfied users.
  • 40% of Internet users claim that failure to update content on a regular basis is a key reason for dissatisfaction.
  • 33% say that not being able to personalize a site leads to indifference.
  • 32% of users mentioned the poor quality of on-site search tools as a reason for not returning to a site, or recommending it to others.
  • 32% of users mentioned the time it takes to download a web page as reasons for not returning to a site, or recommending it to others.

customer service statistics

online customer service: rated 77 (out of a possible 100)
offline retail customer service: 74.8
individual online companies:

  • Amazon: 84 (highest)
  • Barnesandnoble.com: 84
  • eBay: 84
  • 800-Flowers.com: 76
  • average for all online companies: 68.7

Source: University of Michigan Business School, Mar 2002 and ACSI (The American Customer Satisfaction Index), Aug 2002

most important factors for online customer satisfaction, as rated by US customers:

  • Courteous and respectful employees: 73%
  • Consistently good merchandise quality: 70%
  • A clean and well-maintained e-store: 69%
  • A policy of unconditional return of merchandise: 69%
  • Visible prices: 68%


Enchanted Websites
info@enchantedwebsites.com

265 Turkeysag Trail Ste 102 #117
Palmyra, VA 22963
phone: (434) 373-0009
Copyright ©1997- Enchanted Websites
All Rights Reserved

 
Why Us